The MyLabBook approach was developed primarily from our experience at the University of Houston biotech program and then from an NSF funded grant for the Environmental Sampling Research Module (ESRM). We began with the use of the Drupal CMS and then moved to the WordPress CMS due to the reasons covered in the blog of January 21, 2023. Although your research study will probably be different in many ways from the ESRM project, it may be useful to see how we used WordPress to build a research platform and ELN for our studies.
From our experience and feature requests over the years, we determined the following features would be desirable for the data collection aspect of our project (the ELN component).
Forms to collect the results from the data collection and data analysis
A way to display all of the data results together from all of the analysis
A map to display the location of the data points. This should include popup information on the pins concerning our soil samples
An integrated social network to allow messaging between students and faculty members
A good way to present our instructional videos about lab procedures
In addition, we would need a public website to display summaries of our results. This could utilize a subset of the features developed for the ELN component. Each of these features is covered below in greater detail.
Create a Form for the Data Collection and the Analysis Results
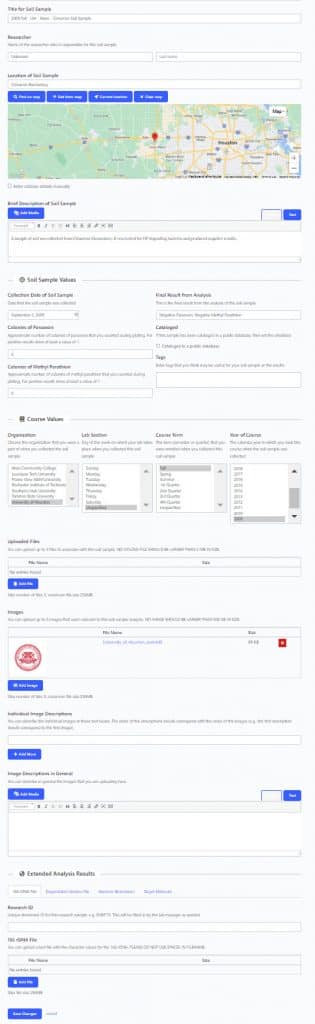
This was of course the most essential feature for our research project. We need a way to capture the data. In our case, the initial data consisted of the location of the soil sample, the date of collection, a title, and a brief description. The soil samples were then analyzed and we needed forms to collect the results of the soil sample analysis. Since the protocol was fixed for our data collection, all of the student researchers used the same form. A screenshot of the entire form is shown below.
Thus, the two essential steps to the protocol were to first record the data about soil sample and then to record the data about the analysis of the soil sample. The data for these steps could be filled in at the top of the form.
The optional information at the bottom of the form includes file uploads (e.g., for reports, more detailed analysis), image uploads and descriptions, and extended analysis results. The extended analysis was performed on samples that were of greater research interest.
The course values in the middle of the form were set by the administrator.
Display All the Data Results Together
This ESRM project was designed for data collection by students for multiple semesters and from multiple academic institutions. Part of the learning experience came from comparison with other soil samples. Therefore, it was important to be able to review data from other student researchers. Some standard approaches to display multiple data sets would be data grids or directories. In the original approach of using Drupal for our ELN, we used the versatile Views module for displaying and filtering multiple data sets. This was the data grid approach.
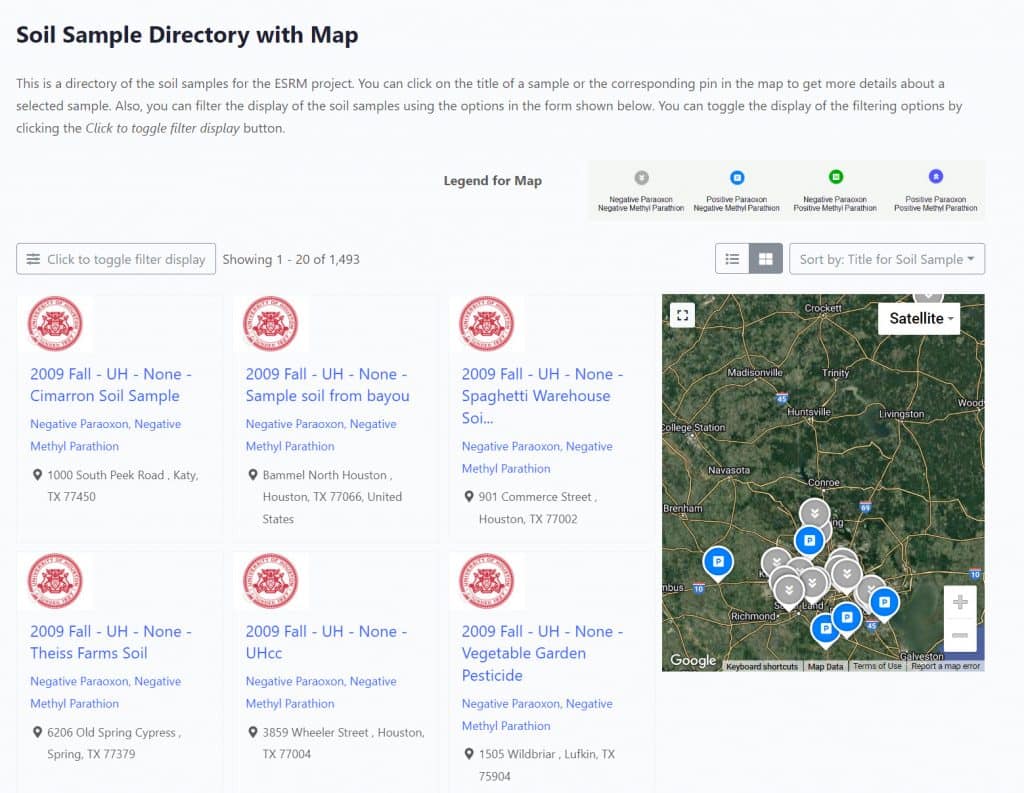
With WordPress, we could not find a comparable data grid, and so we began exploring the use of directories. Directories oftentimes use a taxonomy hierarchy like the original Yahoo or DMOZ directories used in early organizations of web content. Similar directories are used today for business listings, such as variations for the yellow pages (e.g., yellowpages.com). We were pleasantly surprised to find the Directories Pro plugin (an inexpensive commercial product) that not only provided a directory but an integrated map as well. A screenshot of the resulting directory display is shown in the screenshot below.
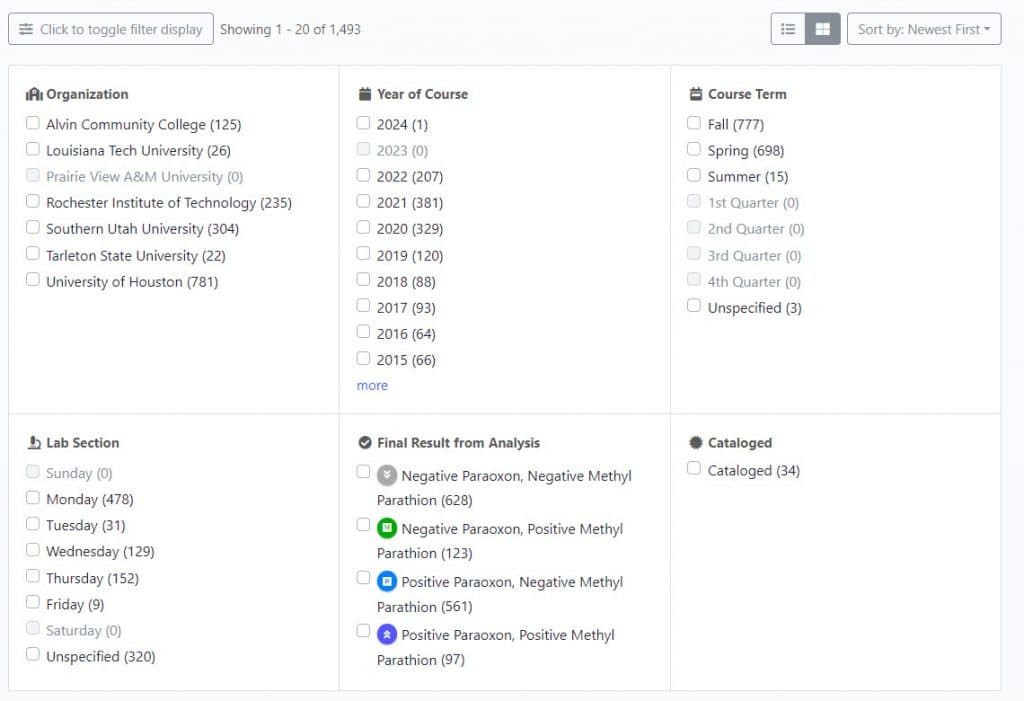
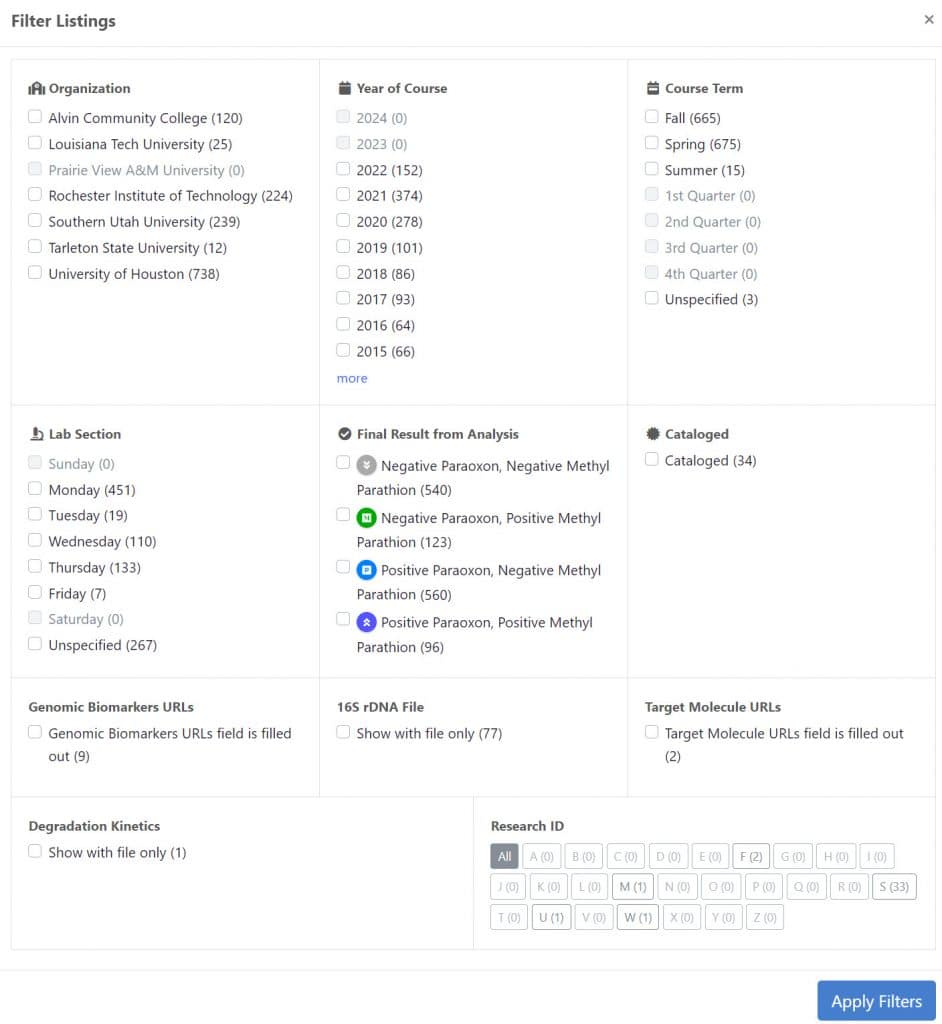
Rather than use a hierarchical display, we chose to use a faceted filter to drill down to soil samples of interest. We were able to designate which facets to use in the filter, so in this case we limited the number of facets to those that would be commonly used by students and faculty. A screenshot of the faceted filter is shown below along with a drop down for the sort order and icons for the type of display of the soil sample summaries.
Add a Map to Display the Location of Soil Samples
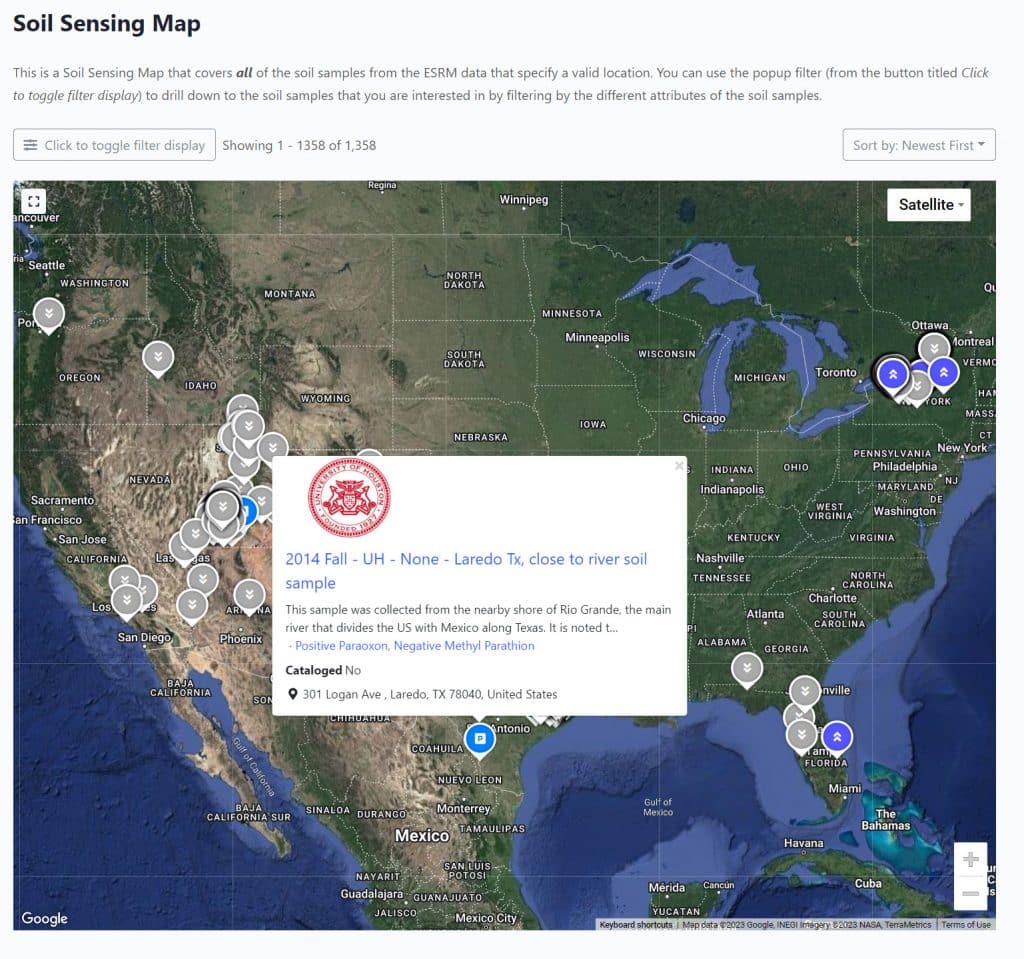
Along with the directory display, we wanted to have the ability to display all of the soil sample locations on a map with popup cards for a summary of the sample. We were able to use the same Directories Pro plugin and an alternate display mode to achieve this. A screenshot of the map with over 1,000 soil sample locations is shown below with an example of a popup summary.
Similar to the directory, we also created a faceted filter for the overall soil sensing map map. In this case, we wanted to include more facets for a more fine grained ability to drill down to specific soil samples. It uses the same approach as the directory of the soil samples. A screenshot of the faceted filter for the soil map is shown below.
Add an Integrated Social Network
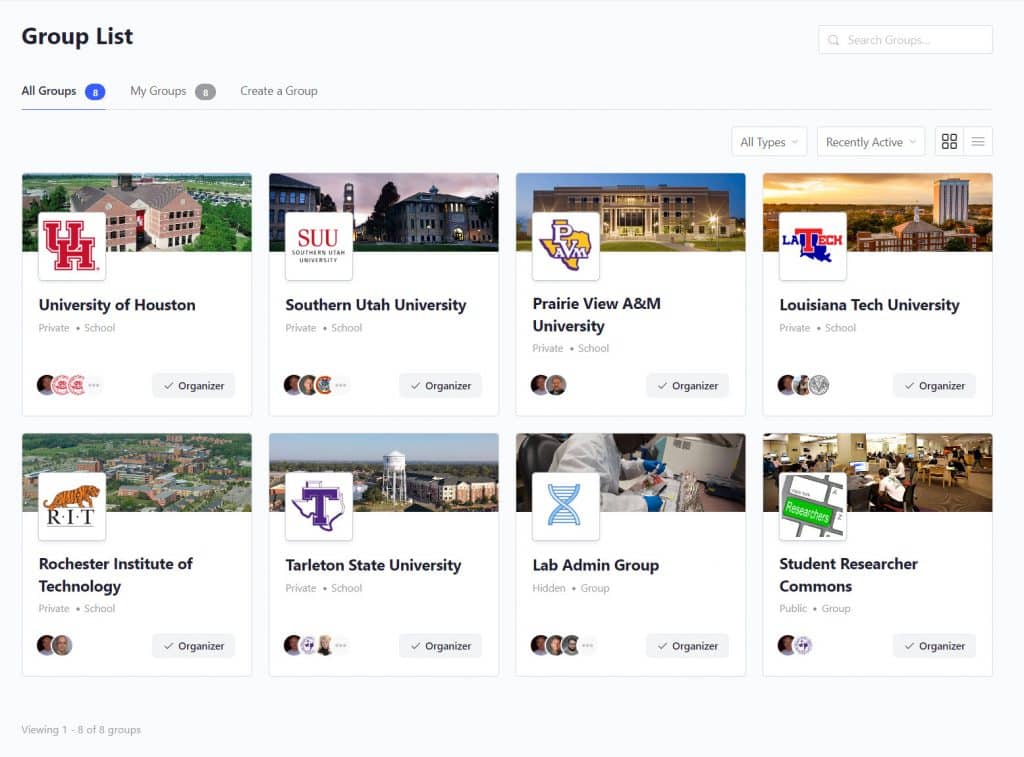
After a few years of collecting data and trying to optimize interaction between students and between students and faculty, it was suggested that we add some social networking features to the ELN. Our first approach was to try to use the Open Social platform since at the time we were using Drupal for our ELN. However, we found that Open Social was difficult to customize and fully integrate with the data collection and data display aspects of our ELN. As explained in our blog post of January 21, 2023, this difficulty of integration was a major motivator to explore WordPress. WordPress has a free social network plugin called BuddyPress that is produced by Automattic, the company behind WordPress. For our needs, we found that a commercial extension of BuddyPress called BuddyBoss was easier to work with. So, we implemented BuddyBoss on our site with the features of groups, members lists, personal profiles, messaging, and notifications. A list of the groups is shown in the screenshot below.
Provide Instructional Videos
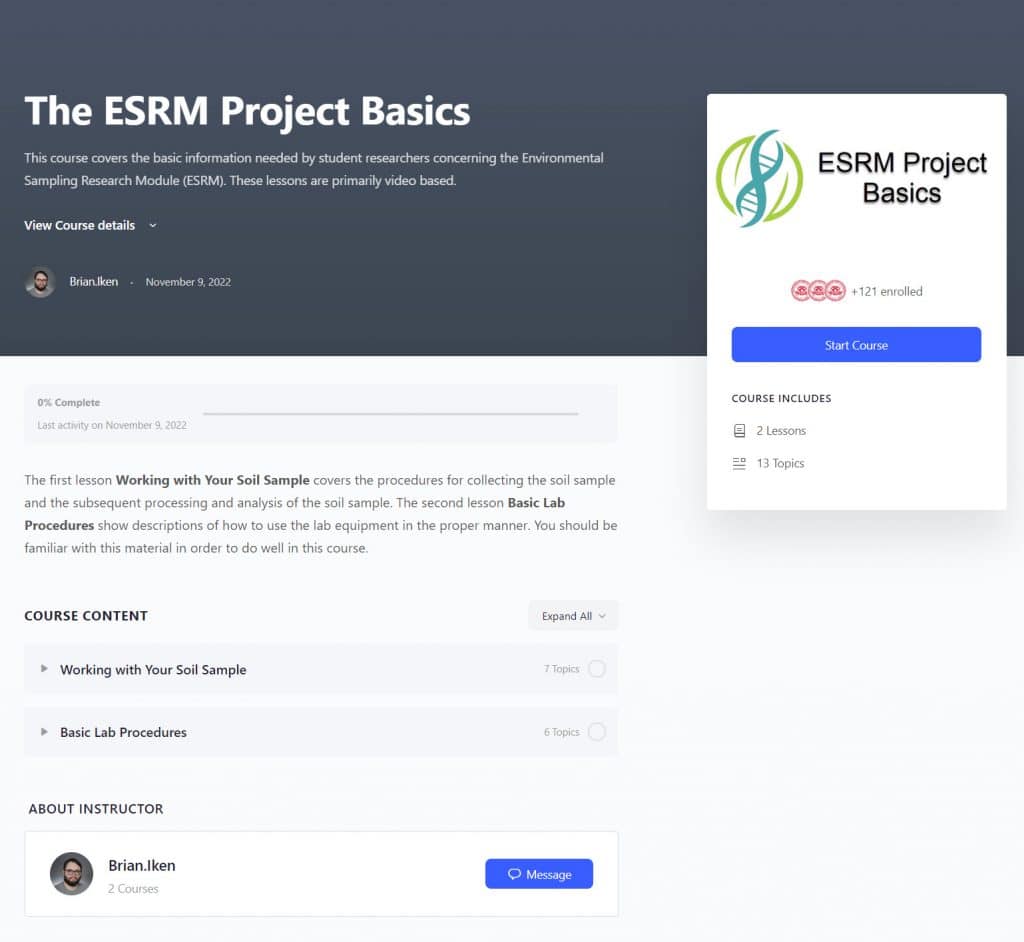
Early in our NSF grant, our lab administrators produced a series of high quality instructional videos explaining in detail the soil collection and analysis process, the preparation of different media for the soil sample processing, and how to use the lab equipment appropriately. There are numerous plugins that can display videos embedded within a page or post. However, there are also several Learning Management Systems (LMS) that provide an even more structured approach to viewing the videos. After some evaluation, we chose the commercial system of LearnDash for our LMS. We have not yet used many available features in LearnDash like quizzes, questions, certificates, and assignments. However, they may prove useful in the years to come. A screenshot of the set of videos for the basic procedures is shown below.